

Habit Rabbit’s Ratings Recovered. We Analyzed 2,337 Reviews to See What Changed.
Published 22nd September, 2026 by Claire McGregor
A rising app rating looks like good news, and for Habit Rabbit it certainly does.
The gamified habit tracker launched strongly in 2021, when reviews in our Appbot dataset averaged 4.73 stars on iOS and 4.51 on Google Play. Over the following years, those averages gradually declined. iOS fell below four stars in 2023 and reached 3.85 in 2025, while Google Play followed its own downward trajectory, reaching 3.97 stars in 2025.
In this analysis you’ll learn:
- Habit Rabbit’s App Ratings Tell a Five-Year Story
- What Changed as Habit Rabbit’s Ratings Recovered?
- Improving Ratings Can Hide Persistent Feature Requests
- iOS and Google Play Don’t Tell Exactly the Same Story
- App Version Data Adds Context
- How Can Product Teams Analyze an App Rating Recovery?
- The Rating Is the Signal. The Reviews Provide the Context.
- Frequently Asked Questions

Want to find out what changed in your own app reviews?
Try Ask Appbot, free for 14 days →In 2026, both started moving in the other direction. Through August, Habit Rabbit’s reviews averaged 4.05 stars on iOS and 4.18 on Google Play, giving iOS its strongest annual result since 2022 and Google Play its strongest since 2023.
On the surface, the conclusion is straightforward: Habit Rabbit’s ratings recovered.
When we used Appbot to analyze the reviews behind those numbers, though, a more useful story emerged. The problems users talked about didn’t simply disappear as ratings improved. Some complaints that had dominated earlier releases became less prominent, other issues became easier to see, and long-running feature requests continued to surface.
For product teams, that’s the important lesson. A recovered app rating tells you customer sentiment is moving in the right direction. Analyzing the reviews can help you understand what changed underneath it and what still needs attention.
Habit Rabbit’s App Ratings Tell a Five-Year Story
We analyzed 2,337 Habit Rabbit reviews across the Apple App Store and Google Play from September 2021 through August 2026, including 818 iOS reviews and 1,519 Google Play reviews. The annual averages show a clear decline-and-recovery pattern:
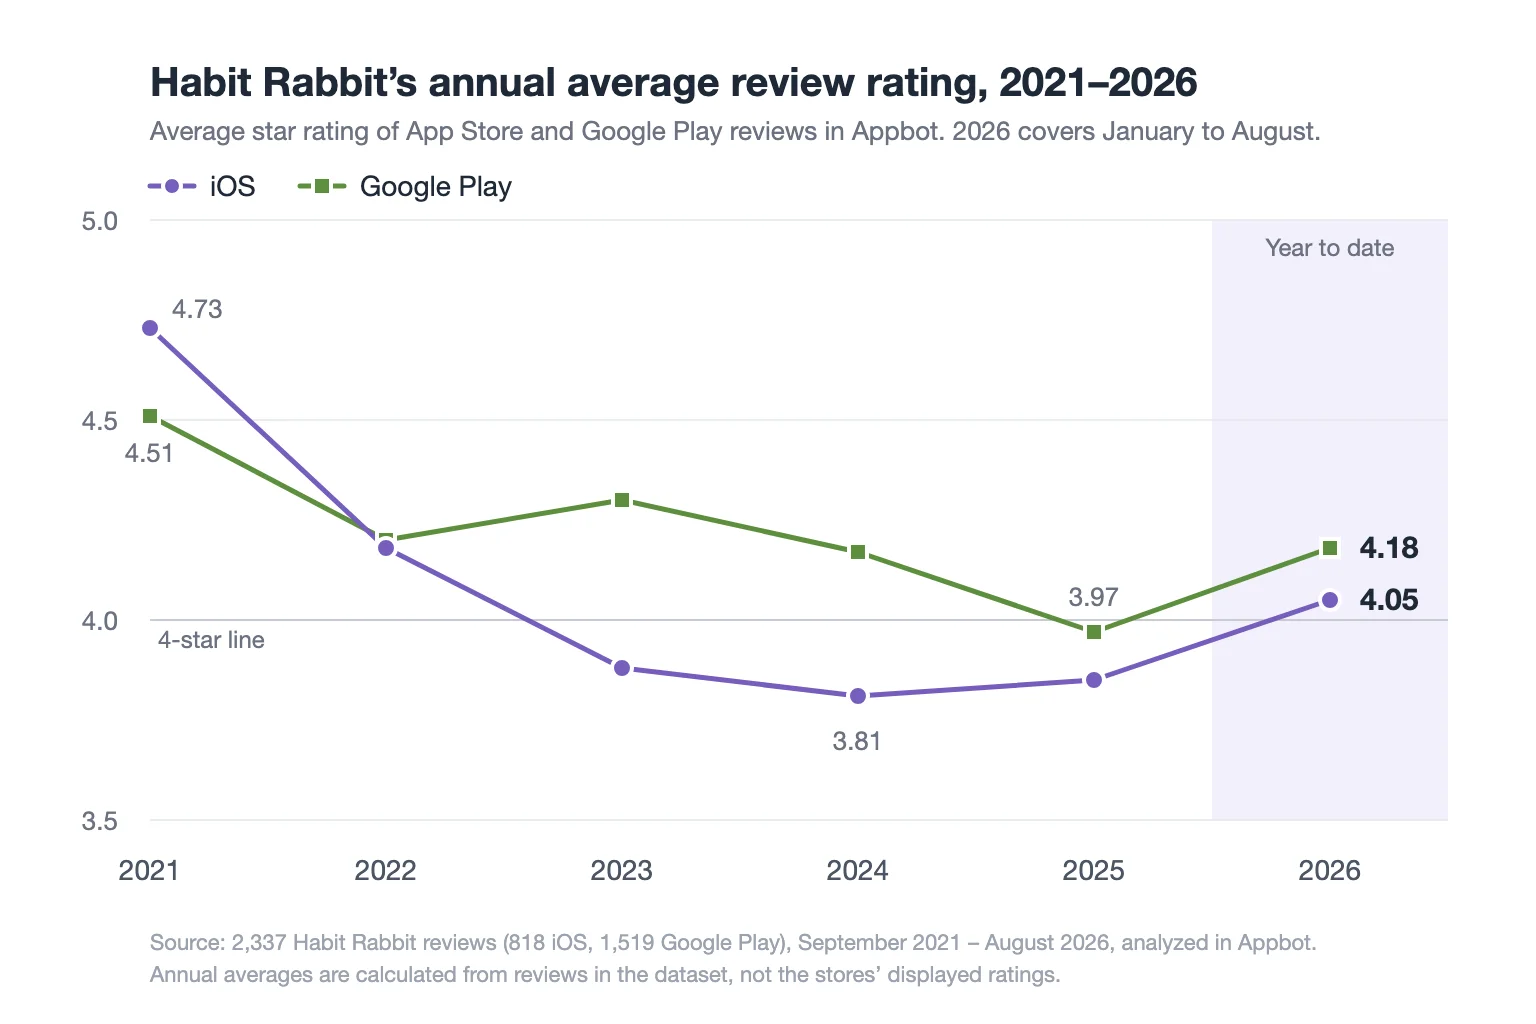
The two stores didn’t move in lockstep. Google Play remained above four stars through 2024 while iOS had already dropped below it. By 2025, however, the annual averages had converged at just under four stars. In 2026, both rebounded.
For a product team, that movement raises a more useful question than simply whether the rating went up: What changed in the reviews behind it?
What Changed as Habit Rabbit’s Ratings Recovered?
To investigate the recovery, we looked beyond star ratings and examined the themes appearing in negative and mixed reviews across three release periods.
Because the Google Play reviews in this dataset don’t carry a version number, this part of the analysis uses the 139 negative and mixed iOS reviews that Appbot matches to the app version the reviewer was using. We used Appbot’s Sentiment and version filters to isolate those reviews for each release period, then read each one and grouped the complaints it raised into themes, using Appbot’s Topics tags as a guide.
During the version 4.x period from late 2023 into 2024, reviewers raised problems with ad frequency, bugs, onboarding and pricing. Ads were by far the most prominent complaint, appearing in 58% of negative and mixed reviews. Pricing and habit limits appeared in 18%, while bugs and onboarding confusion appeared in around 15% each.
That pattern became even stronger across versions 5.02–5.05, when ads were mentioned in 75% of negative and mixed reviews. Reviewers described ads appearing after habit check-offs and, in some cases, several appearing within a very short period. Pricing and paywall complaints remained around 19%, while smaller numbers of reviews raised localization, sync and login problems, and the loss of offline functionality.
By version 5.12, represented in the 2026 data, the mix of negative feedback looked noticeably different.
Ads remained the largest complaint, but their share had fallen to 42%. Pricing and paywall complaints fell sharply from 19% to 4%. At the same time, freezing and glitching appeared in 12% of negative and mixed reviews, login and verification problems in 8%, and repeated prompts to leave a review, a theme that hadn’t appeared in the earlier periods, in 12%.
| Complaint theme | v4.x n=33 | v5.02–5.05 n=80 | v5.12 n=26 |
|---|---|---|---|
| Ads | 58% | 75% | 42% |
| Pricing and paywalls | 18% | 19% | 4% |
| Freezing and glitching | 15% | 5% | 12% |
| Onboarding and usability | 15% | 6% | 12% |
| Login and verification | 3% | 4% | 8% |
| Review prompts | 0% | 0% | 12% |
Share of negative and mixed iOS reviews mentioning each theme, by release period. A review that raises more than one issue counts towards each theme, so columns don’t sum to 100%. The 5.12 sample is small, so its figures should be treated as indicative.
The important finding isn’t that Habit Rabbit stopped receiving negative feedback. It didn’t. The mix of negative feedback changed while the ratings recovered.
Review data can’t establish that those changes caused the rating recovery. Ratings can be affected by product changes, review volume, shifts in the user base and many other factors.
What review analysis can do is make the investigation much more precise. Instead of asking broadly why a rating went up, teams can identify which negative themes declined, which persisted and which new problems emerged.
Improving Ratings Can Hide Persistent Feature Requests
A recovering rating can also hide feedback that hasn’t gone away.
Across the reviews we analyzed, users repeatedly requested a home screen widget on both iOS and Google Play. The request began appearing in 2022 and was still present in reviews in 2026, making it a persistent feature request across roughly four years of product development.
Users also repeatedly asked for more flexible habit scheduling, additional customization, broader localization, more interaction with the virtual pet, changes to free-tier habit limits and clearer ways to identify missed days.
These requests matter because useful product feedback isn’t confined to one- and two-star reviews. A customer can love an app, give it five stars and still identify a gap that matters to them.
When similar requests continue appearing across years, platforms and releases, the cumulative pattern can be more significant than any individual review suggests.
iOS and Google Play Don’t Tell Exactly the Same Story
Across the complete dataset, approximately 68% of reviews were classified as positive by Appbot’s sentiment analysis, but sentiment differed between the two stores.
Around 63% of iOS reviews were positive compared with approximately 71% on Google Play. Negative sentiment represented about 21% of iOS reviews and 15% of Google Play reviews.
| Platform | Reviews | Positive | Negative |
|---|---|---|---|
| iOS | 818 | ~63% | ~21% |
| Google Play | 1,519 | ~71% | ~15% |
| Combined | 2,337 | ~68% | ~17% |
Sentiment as classified by Appbot across all reviews in the dataset, September 2021 to August 2026. Neutral and mixed reviews make up the remainder in each row.
The review text also surfaced platform-specific differences.
iOS reviewers reported sync problems, including habit lists failing to populate correctly on another device, while Google Play reviews included a recurring issue where adding or editing a habit sometimes failed. Notification problems appeared on both platforms.
The clearest platform difference, though, was language.
Using the same date windows as the three iOS release periods, requests for the app in Spanish, Turkish, Portuguese, Arabic and Russian, or complaints that the language setting didn’t work, appeared in 7% of negative and mixed Google Play reviews in the earliest period, 15% in the next and 20% in the most recent window.
The same theme barely registered in iOS reviews.
That means localization was appearing in one in five negative and mixed Google Play reviews in the most recent period, a problem a team looking only at combined data, or only at iOS, could easily miss.
Combining App Store and Google Play reviews is useful. Flattening them into a single number isn’t.
An overall sentiment figure can show the health of the product across stores, while platform filters reveal whether the same product is producing different problems for different users.
App Version Data Adds Context
Matching reviews to app versions adds another layer of context because several years of customer feedback no longer need to be treated as one enormous pool.
Teams can compare complaints, praise and feature requests across releases, check whether supposedly resolved issues continue to appear, and identify new themes as they emerge.
For a rating recovery like Habit Rabbit’s, that makes it possible to ask which issues survived multiple releases, and what today’s four- and five-star reviewers praise that earlier reviewers didn’t.
The rating provides the trend line. Version data and review text provide the context needed to investigate it.
How Can Product Teams Analyze an App Rating Recovery?
A useful rating recovery analysis combines star ratings, sentiment, topics, app versions, platforms and recurring feature requests rather than relying on the headline rating alone.
Appbot brings App Store and Google Play reviews together and enriches them with ratings, Sentiment, Topics, Custom Topics, Keywords, versions and other review metadata.
If your app’s rating has recently improved, a useful starting point is to compare negative Topics before and after the recovery. Look for complaints that declined, problems that persisted and new themes that emerged. Store, date, rating and version filters can then help determine where those changes occurred.
Custom Topics can be used to monitor issues or features specific to your product, while Ask Appbot and the Appbot MCP let teams interrogate the same review data using natural-language questions such as:
- Which negative topics have declined since our ratings started improving?
- What are one-star reviewers complaining about now compared with last year?
- Which complaints are still appearing despite our rating recovery?
- What do recent five-star reviewers praise most often?
- Which feature requests have persisted across multiple versions?
The aim isn’t to ask AI to declare why a rating moved. Review data alone can’t prove causation. The value is being able to find the evidence worth investigating among thousands, or even millions, of individual customer reviews.
The Rating Is the Signal. The Reviews Provide the Context.
Habit Rabbit’s recovery looked straightforward from the outside. iOS rose from 3.85 to 4.05 and Google Play from 3.97 to 4.18.
The reviews told a more useful story.
Ad and pricing complaints became less prominent, technical issues remained, new complaints emerged, long-running feature requests persisted, and the customer experience differed between iOS and Android.
A star rating compresses all of that feedback into one number. Review analysis adds the context product, support and customer experience teams need to understand what changed and where to investigate next.
Comparing five years of Habit Rabbit reviews across two stores, multiple versions and 2,337 individual comments took Appbot’s filters and a handful of questions in Ask Appbot, not a spreadsheet.
How long would it take your team to find out what changed behind your last rating recovery?
Frequently Asked Questions
Why should you analyze app reviews after your rating improves?
An improving rating shows the direction of customer sentiment, but not what changed underneath it. Review analysis can reveal which complaints declined, which persisted and which new issues emerged.
What is an app rating recovery analysis?
It compares review sentiment, topics, feature requests, platforms and app versions before and after a rating improvement to identify what changed alongside the recovery and what still needs attention.
Can app reviews prove why a rating went up?
No. Review analysis is observational. It can show which feedback changed alongside a rating recovery, but it can’t establish that those changes caused the improvement.
Why compare iOS and Google Play reviews separately?
Because the same product can produce different feedback on different platforms. In Habit Rabbit’s case, localization became increasingly prominent in Google Play reviews while barely appearing on iOS.
How do app versions help with review analysis?
Version data lets teams group reviews by release, making it easier to identify release-specific complaints, persistent issues and changes in feedback over time. In this dataset, version-level comparisons rely on iOS because the Google Play reviews didn’t carry version numbers.
Want to find out what changed in your own app reviews?
Try Ask Appbot, free for 14 days →Where to from here?
- Read our follow-up on how Claude’s app reviews changed after Fable 5 returned, another example of complaints shifting rather than disappearing.
- Learn what happens when your app rating is low and why the recovery deserves just as much attention as the decline.
- For the process itself, read our guide to analyzing app reviews at scale.
- Unlock valuable insights into user sentiment with our powerful sentiment analysis tool for informed decision-making.
- Track recurring complaints and feature requests automatically with Appbot’s topic analysis tools.
About The Author

Claire is the Co-founder & Co-CEO of Appbot. Claire has been a product manager and marketer of digital products, from mobile apps to e-commerce sites and SaaS products for the past 15 years. She's led marketing teams to build multi-million dollar revenues and is passionate about growth and conversion optimization. Claire loves to work directly with the world's top app companies delivering tools to help them improve their apps. You can connect with her on LinkedIn.
Enjoying the read? You may also like these
 Claude Fable 5 Came Back. Users Had a Different Complaint.
 We analyzed 11,090 Claude app reviews after Fable 5 returned. See how user sentiment shifted from availability to pricing, limits and trust.
We analyzed 15,512 Claude app reviews after the launch and withdrawal of Claude Fable 5. Discover what ratings, sentiment, emotions, topics, and keywords revealed about user reactions.
App reviews surface bugs, feature requests, usability problems and the language users use to describe your app. What each insight looks like and who acts on it.
When an app has a low rating, it can have a number of negative consequences for both the app developer and the users of the app.