Is there a relationship between App Ratings and Reviews Stars?
Published 18th November, 2024 by Claire McGregor Since prompting for iOS ratings has become common practice we, at Appbot, have noticed a divergence between average Rating and average Review Stars for lots of the larger apps we analyze. Customers often ask us whether the gap between their Ratings and Review Stars is “normal” and it seemed to us that there must be some correlation, so we took a sample of over 4,000 apps to investigate.
 In this overview you'll learn:
- How we sampled the data
- The distribution of ratings vs reviews stars in the sample
- Correlation between App Ratings and Review Stars
- Do high volume apps have a more consistent stars delta?
- What is a "normal" ratio of Ratings Count:Review Stars Count?
- Conclusion
Want to monitor & track your app ratings & reviews?
Try Appbot free now, no credit card needed →How we sampled the data
The apps in the sample are from a broad, randomized cross-section of the App Store - the distribution across different categories corresponds with the relative popularity of each category in the App Store overall (ie. categories with a greater number of apps are proportionately represented in the sample).
| Data range sampled | 10 Nov 2023 - 10 Nov 2024 |
| Initial sample size (apps) | 4225 |
| Count that had not reset ratings in the period | 4087 |
| Count of apps not reset, and had >20 ratings in the period | 3867 |
| Total # Ratings in period (not reset, >20) | 432,005,172 |
| Overall ratio Ratings:Reviews | 36.62 |
We started out with 4225 apps in our sample, but when we looked at the data it became clear than about 5% of those apps had reset their ratings during the sample period. For simplicity, we excluded those. We then analyzed the ratio of ratings to reviews, and it became clear that apps with very tiny ratings volumes (and therefore also review volumes) would skew the results, so we also excluded apps with fewer than 20 ratings in the period - leaving us with a sample of 3867 apps.
Overall the apps in the final sample received 432,005,172 ratings - almost half a billion - and 11,795,510 reviews in the 12 month sample window. This yields an overall ratio of 36.6 ratings per review.
The distribution of ratings vs reviews stars in the sample
The first step in analyzing the relationship between average rating and average review stars was to calculate the median and mean for Ratings and Review Stars:
| Ratings | |
| Mean | 4.2 |
| Median | 4.6 |
| Review Stars | |
| Mean | 2.9 |
| Median | 2.8 |
No big surprises so far; Ratings are 1-2 stars higher than Review Stars for each app.
If we plot Ratings and Review Stars as separate series on a scatter chart (with each app as a point on the X axis) we can see this represented visually:
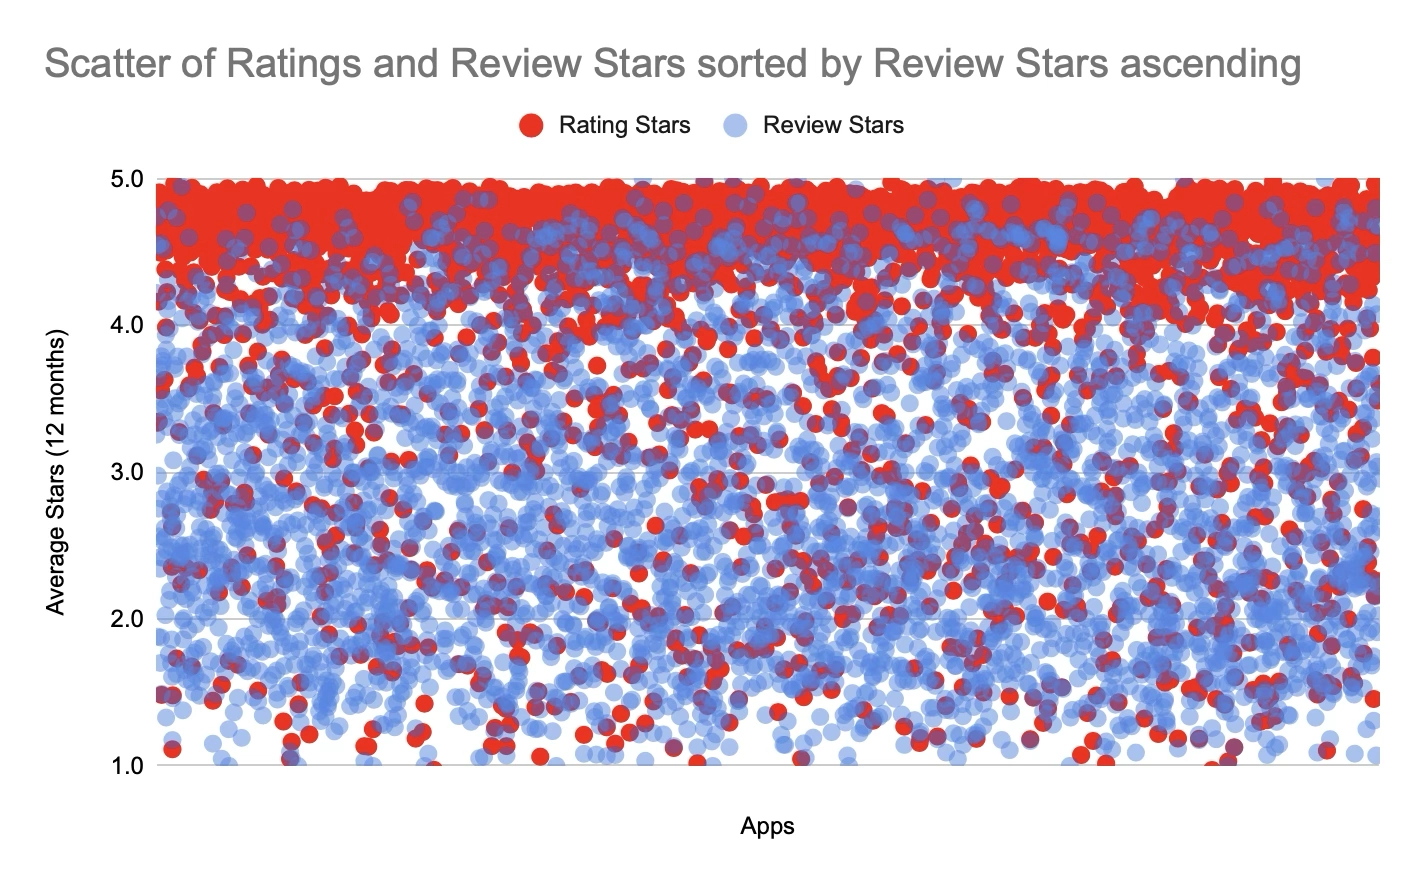
We were very confident Ratings would be clustered higher than Review Stars though so this information on its own didn’t reveal anything unexpected.
Correlation between App Ratings and Review Stars
Next, we had a look to see if we could uncover any obvious correlation between Ratings and Review Stars by sorting the data. First we sorted Ratings into ascending order:
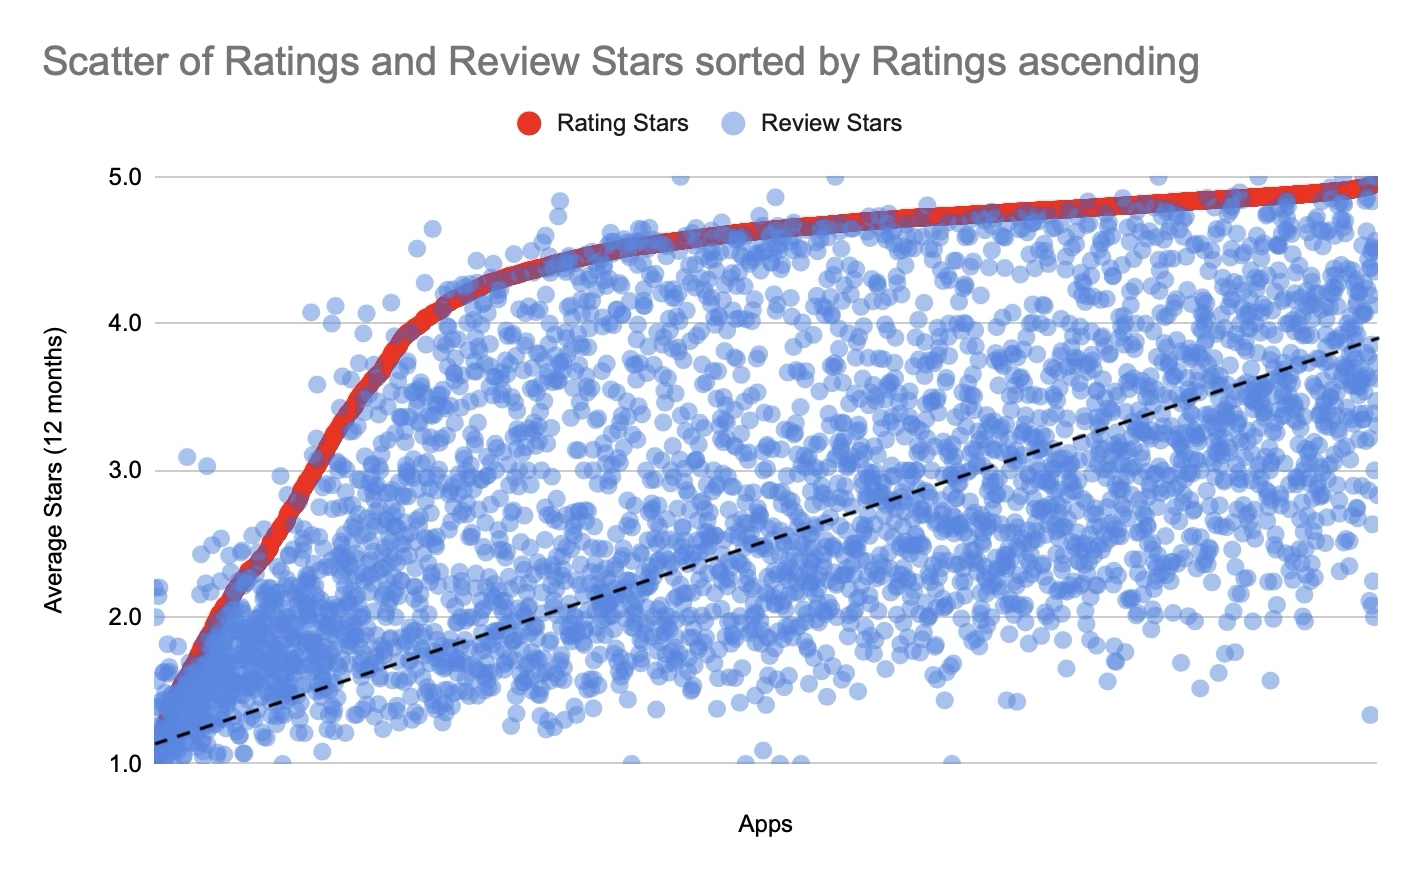
This chart really reinforces that Ratings are heavily clustered between 4 and 5 stars, and that Review Stars are more linearly distributed - shown with the dotted black line of best fit (approximate). We can also see that the small number of apps that had a low Rating all have low Review Stars - these are the apps in the bottom left corner of the chart.
If we sort the data by Review Stars, in ascending order, the output looks like this:
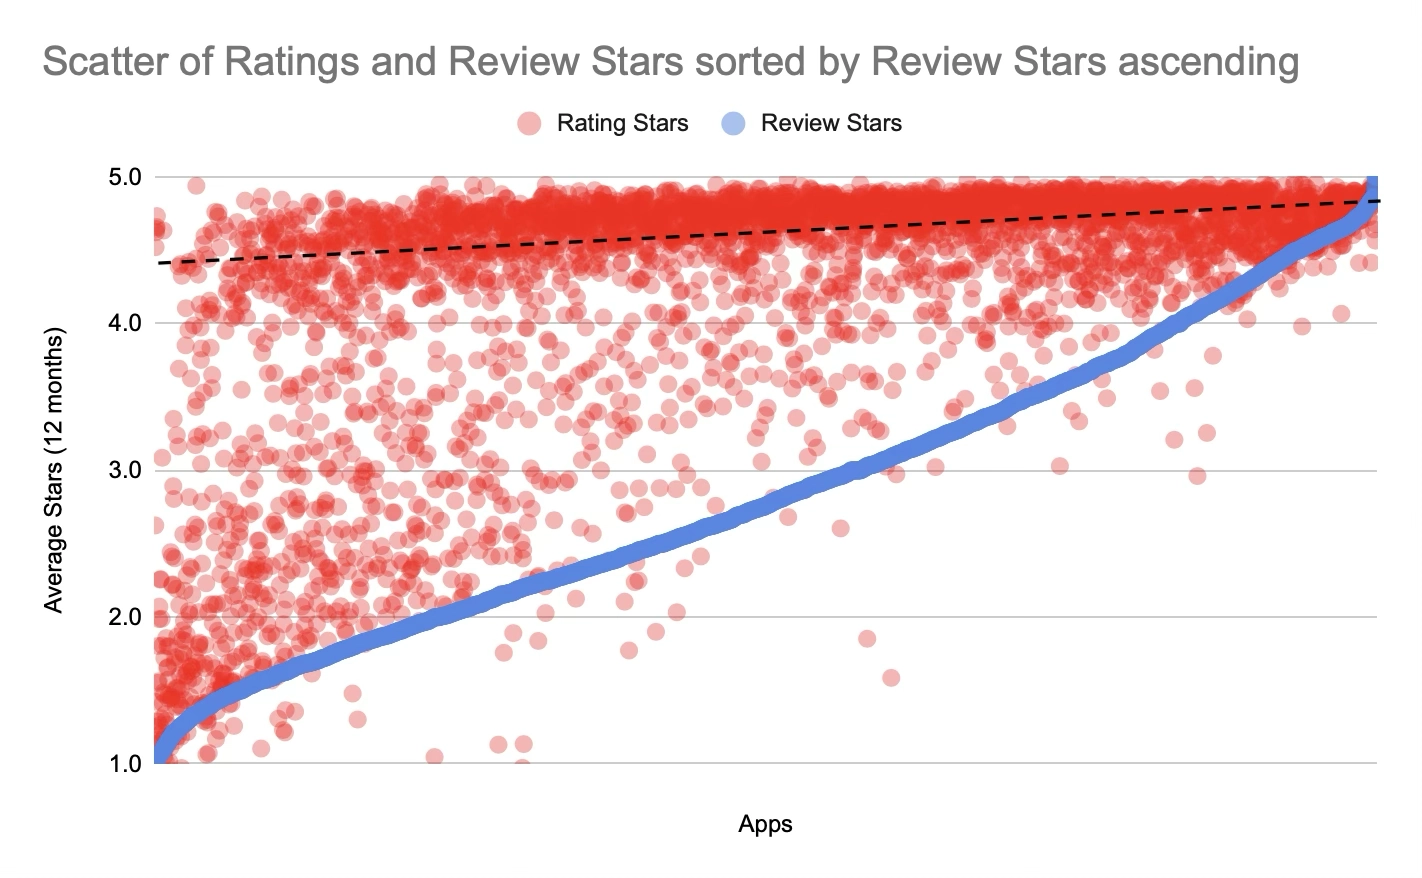
Again there is a cluster in the bottom left, reminding us that if your app is truly underwhelming no ratings or review hacking tactics can save you from low Ratings and Review Stars. This chart really highlights the more linear distribution of Review Stars within this sample, despite the very obvious cluster of high Ratings. Looking at the apps towards the left of the chart, you can see how many apps have a 1-2 star Review Stars, yet still have an average Rating above 4 stars. It makes sense when we consider the increased prevalence of tactics apps are using to push their Ratings towards 5 stars - tactics like prompting for a Rating as soon as users complete onboarding.
We then plotted the two data points against one another on a scatter chart. All three previous charts show one point for Ratings and one for Review Stars for each app so each app, but on the scatter below each app is only represented once at the co-ordinate of Review stars on the y axis and Ratings on the x axis. The result was interesting:
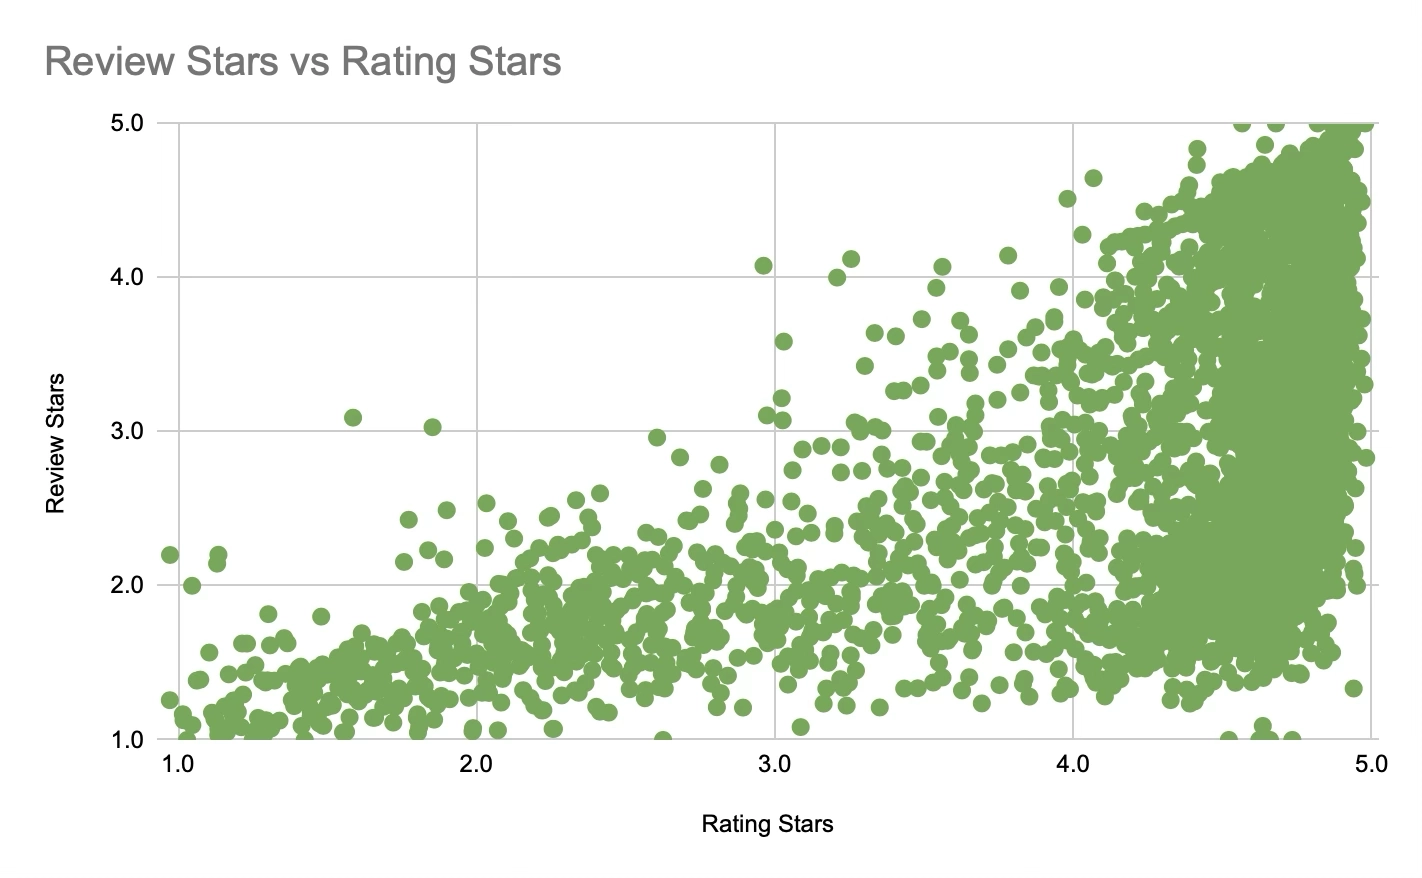
The new pieces of information that viewing the data in this way really highlighted for us were that:
- Very, very few apps have a higher average review stars than rating.
- Ratings averages in the 2.5-4.2 star range are relatively rare - Ratings are much more polarized than Review Stars.
Finally, we calculated the delta between Rating and Review Stars (delta = Rating - Review Stars), rounded the result to 2dp and plotted it as a column chart, sorted in ascending order again.
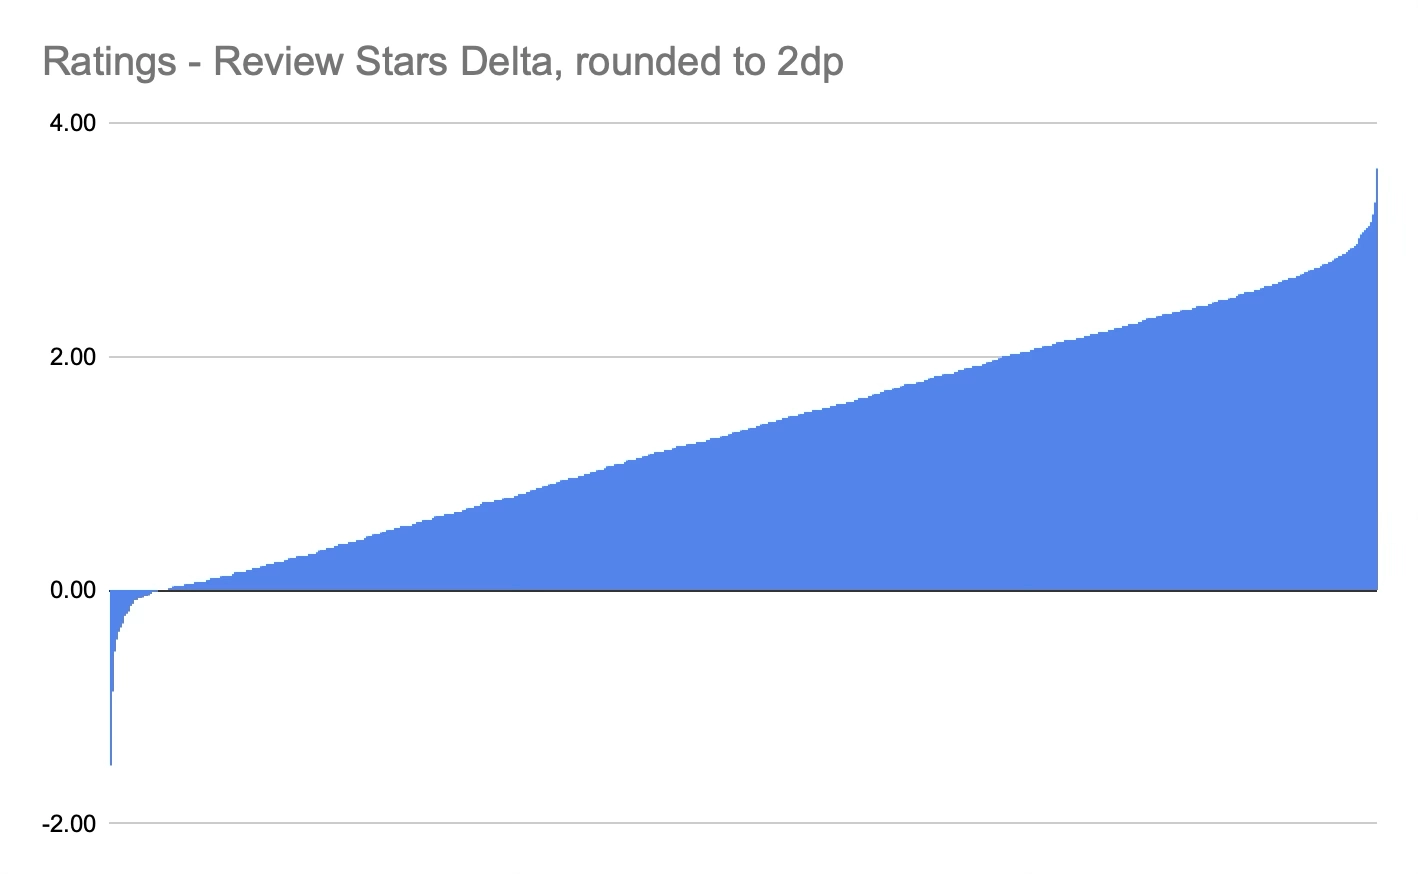
This gave an even clearer representation of how few apps have a higher Review Stars than Rating, but also really highlights that the delta varies so dramatically across the sample. We assumed that the data would follow a normal distribution if we plotted the delta on the x axis. We started by plotting the data set we already had, which was rounded to 2dp, and the chart looked like this:
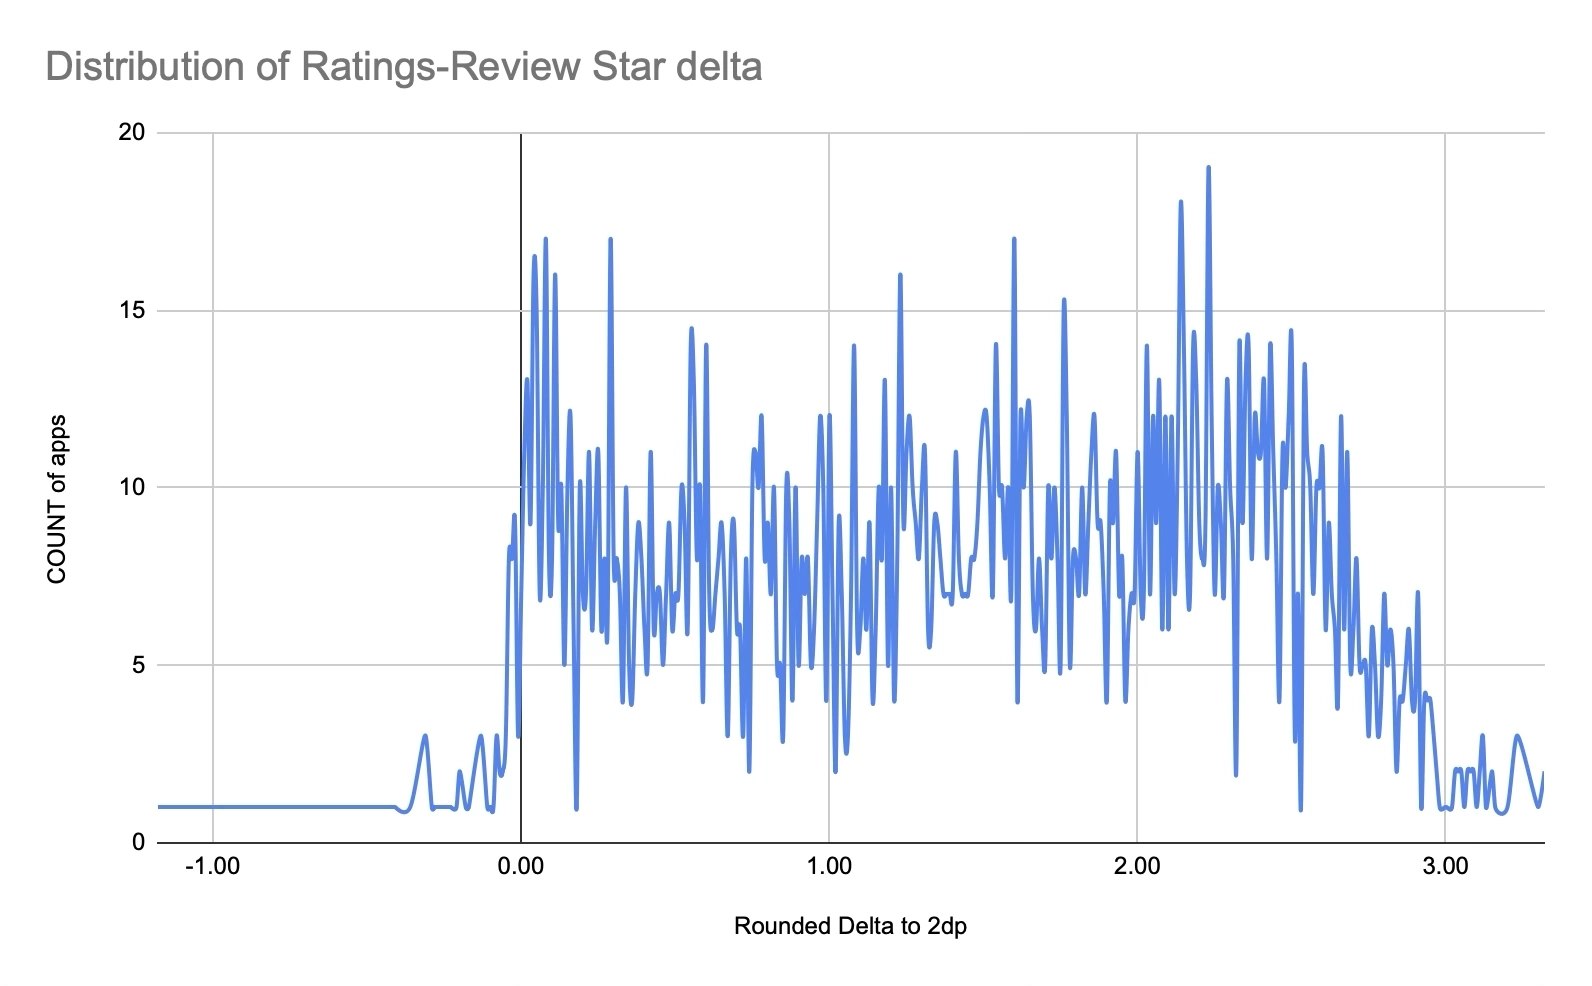
So we grouped the values by rounding to the nearest 0.5 stars, and the chart roughly followed the normal distribution we expected.
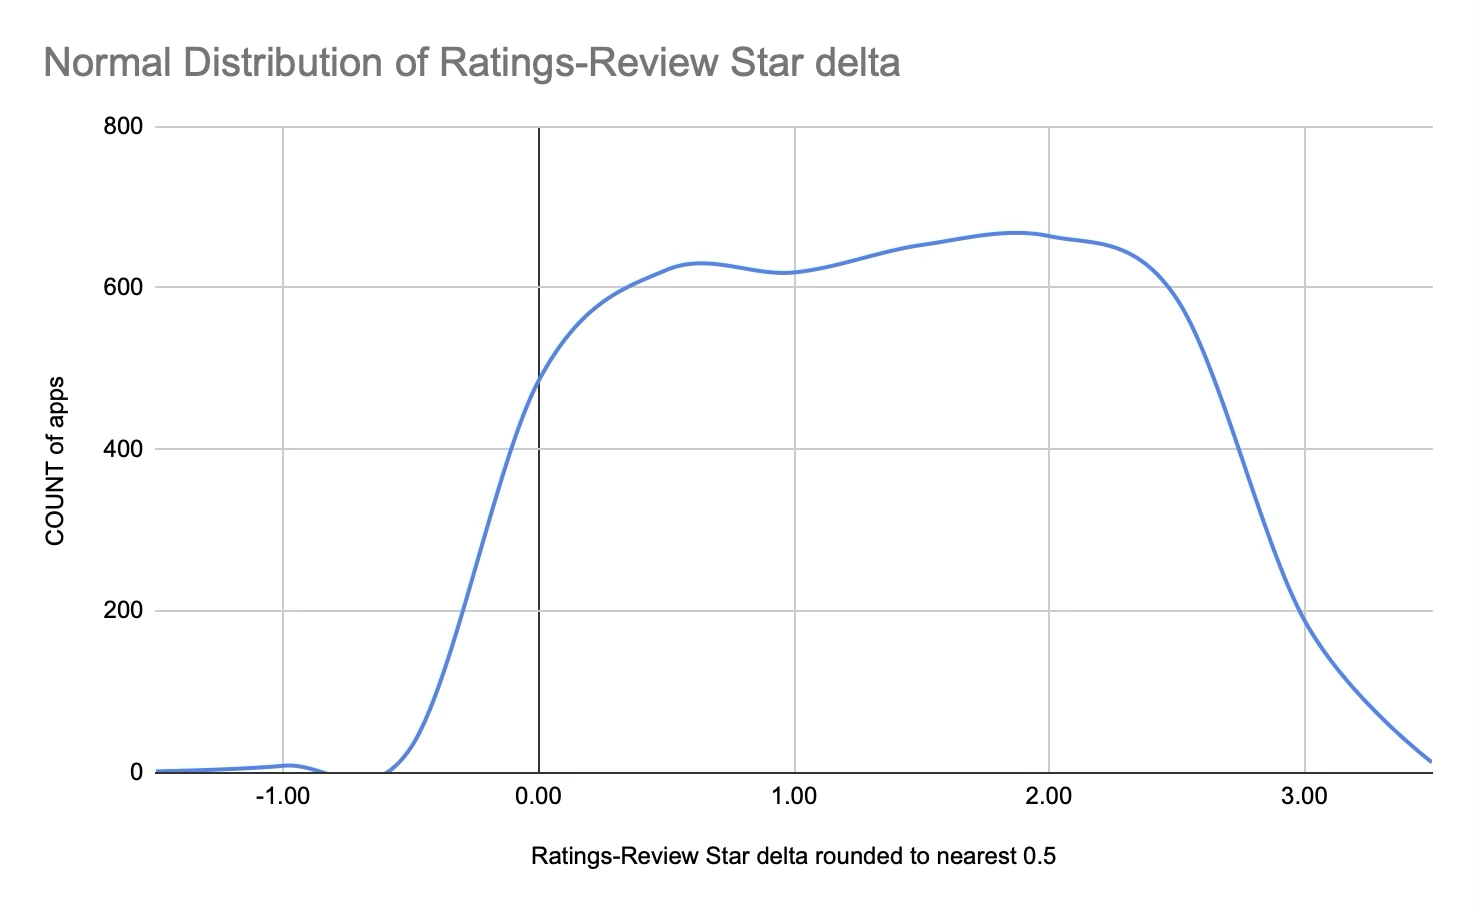
The max is 3.73, minimum value is -1.50, median is 1.37 and (surprisingly) the mean is 1.37 also. The standard deviation is 0.896 stars. On average, apps have an average Rating 1.37 stars higher than their average Review Stars, but the delta can range from 3.73 stars to -1.5 stars.
In summary, this data wasn’t quite what we expected. We anticipated a fairly clear correlation between Rating and Review stars for a given app, but what we found is the two values can vary hugely, with no clear correlation.
Do high volume apps have a more consistent stars delta?
Before we started this investigation, we hypothesized that higher volume apps would have a lower delta between Rating and Review Stars, our thinking being that high volume probably loosely equates to high quality, and high quality apps should have high Rating AND Review Stars.
Once again, we were wrong 🫠
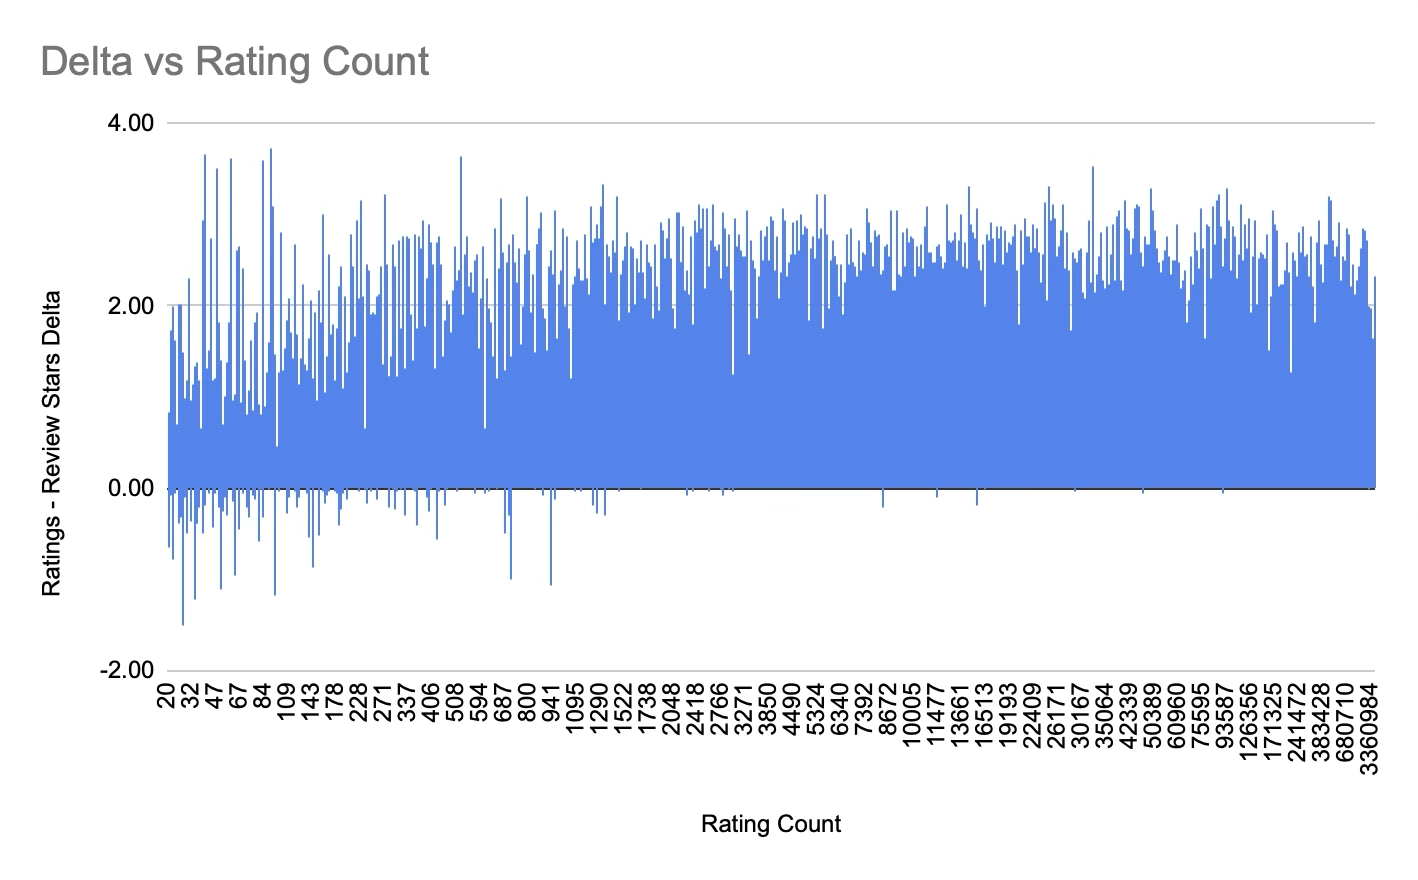
Here we can see that there’s very little relationship between Rating Count and Stars delta. The apps with a low Rating Count (left hand end of the chart) are certainly less consistent, which comes as now surprise given their low Rating volume - the small sample for both Ratings and Review Stars for these apps yields deltas that vary wildly. We can also see that there’s no obvious downward trend for the high volume apps - the delta remains consistently volatile from approximately 1,000 Ratings and above.
What is a "normal" ratio of Ratings Count:Review Stars Count?
Almost every app in the app has a higher count of Ratings than Review Stars, but once again we wondered if there’s a useful benchmark of “normal” in the data. We calculated the ration by taking the count of Ratings and dividing it by the count of Review Stars for each app. When we looked at the resulting values these were the results:
| Ratings: Review Stars Count Ratio | |
| Min | 0 |
| Max | 2912 |
| Mean | 43 |
| Median | 20 |
| Std Dev | 78 |
This data did surprise us, somewhat; a ratio of nearly 3000 more Ratings then Review Stars was definitely a lot higher than expected! The mean value of 43x more Ratings than Review Stars was within the parameters we expected - we had guessed this value would be somewhere between 10 and 100, based on our anecdotal experience looking at ratios for customers.
414 apps, 10.7% of the 3,867 in the sample, had a ratio of 2, and 940 apps (24.3%) had a ratio of 1-3. Despite this cluster, we still needed to use a logarithmic scale to visualize the results:
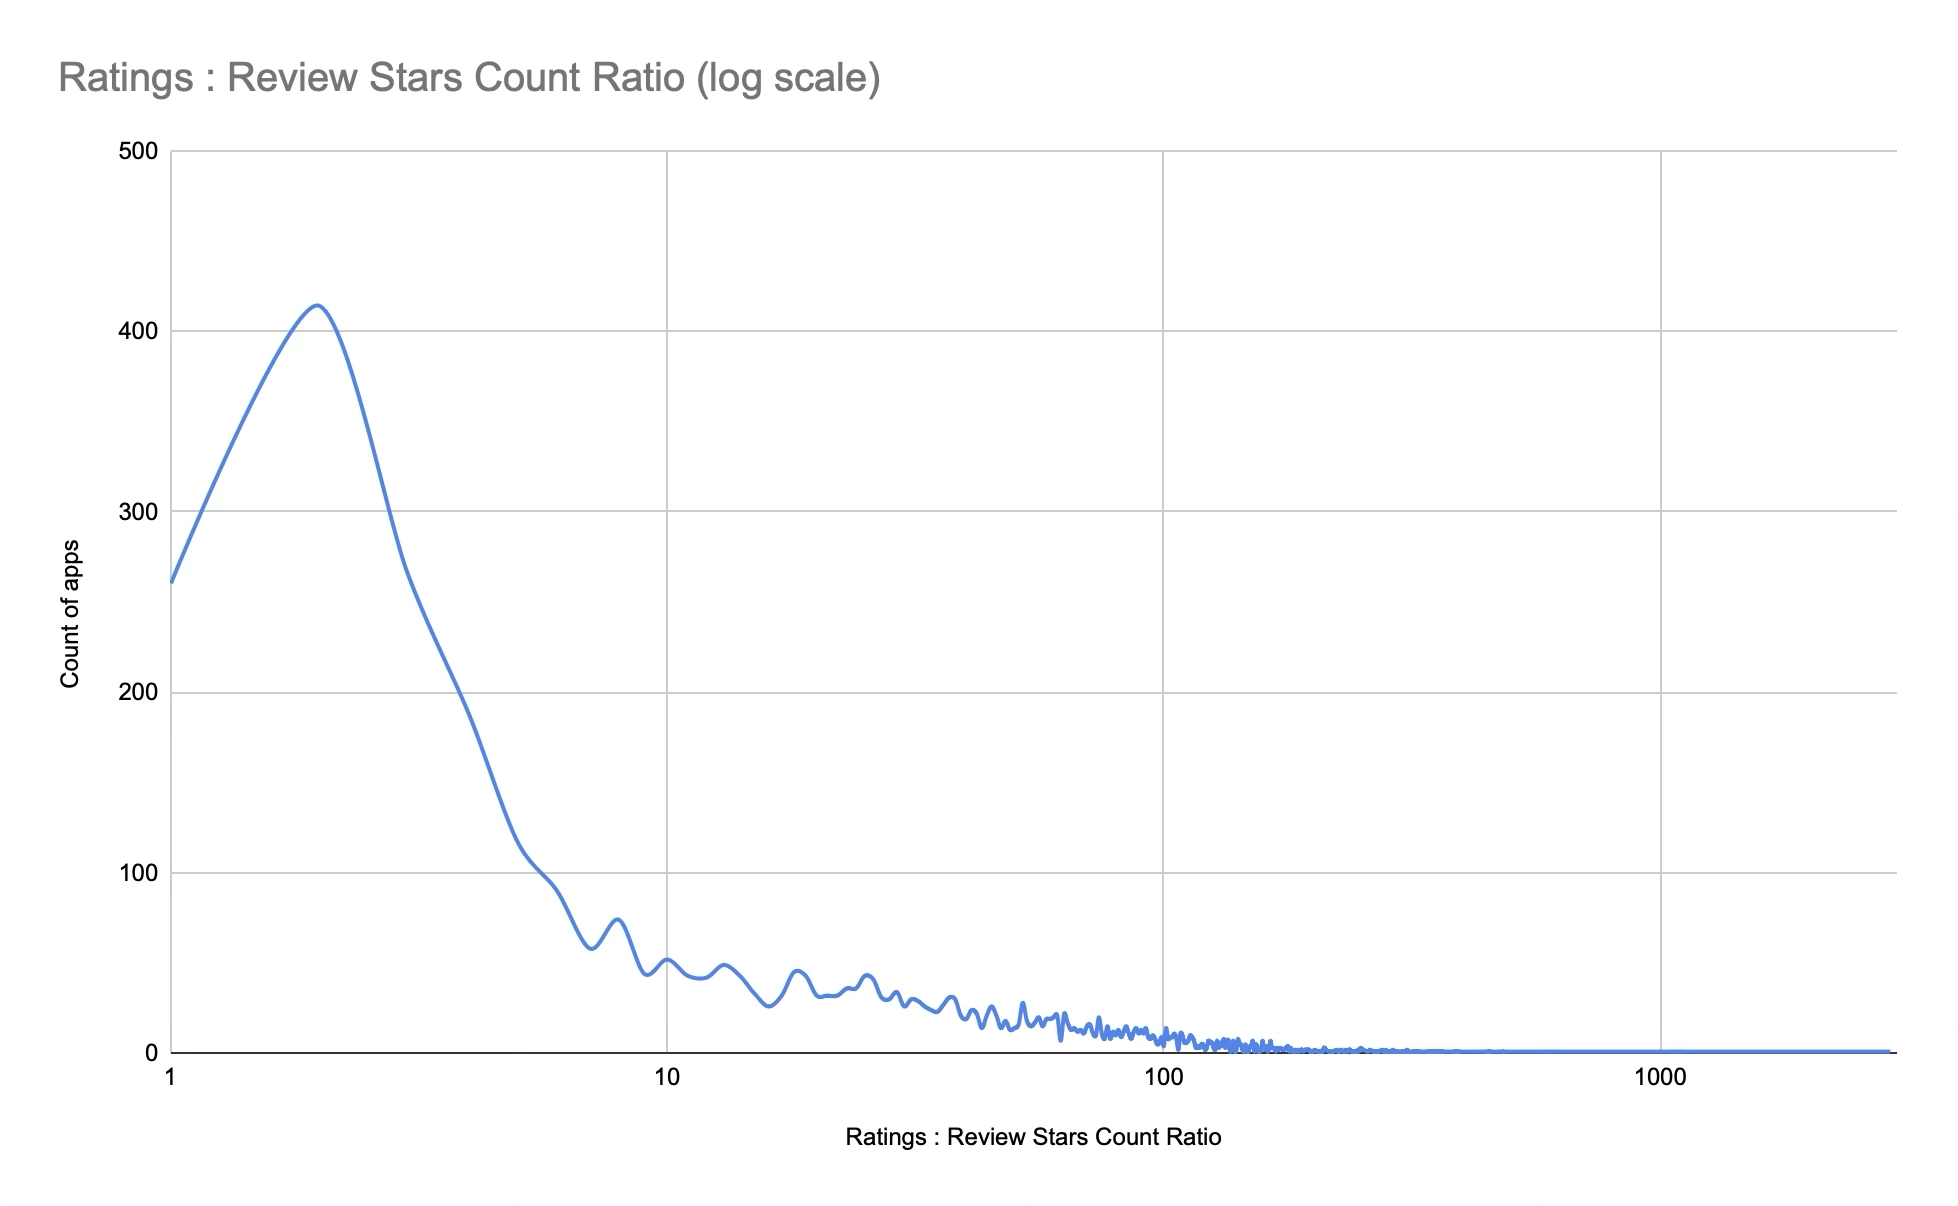
A ratio of 1-3 is common, but still represents less than 25% of the sample. We concluded that there is no clear “normal” here.
Conclusion
When looking at Ratings compared to Review Stars there really is no obvious benchmark, or even any clear trends based on volume. Our key findings from this analysis are listed below:
Ratings vs. Review Stars Distribution: Ratings are heavily clustered between 4-5 stars, while Review Stars show a more linear distribution. Apps with lower Ratings consistently had low Review Stars.
Delta Between Ratings and Review Stars: The difference (delta) between Ratings and Review Stars varied significantly, with an average delta of 1.37 stars. While most apps had higher Ratings than Review Stars, the delta ranged from -1.50 to 3.73 stars.
Correlation and Volume Impact: Contrary to expectations, no strong correlation between Ratings and Review Stars was found, nor did higher volume apps show more consistency in the delta. Ratings remained polarized, even for high-volume apps.
Ratings-to-Reviews Ratio: While most apps had significantly more Ratings than Reviews, the ratios varied widely, with no clear “normal” benchmark. A minority of apps had a ratio of 1-3, but outliers with ratios in the thousands skewed the data.
There is no definitive correlation or standard benchmarks for Ratings and Review Stars. In our opinion, this analysis highlights the complexity and variability in how users rate and review apps, and the influence of factors like ratings and review prompting methodologies.
Want to monitor & track your app ratings & reviews?
Try Appbot free now, no credit card needed →Where to from here?
- Discover effective strategies to managing app store ratings and reviews for app success.
- Automate your app store review responses with intelligent AI replies.
- Dive into the secrets of designing addictive apps that keep users coming back for more.
- Explore the benefits of slack app store integration or seamless communication and review tracking.
About The Author

Claire is the Co-founder & Co-CEO of Appbot. Claire has been a product manager and marketer of digital products, from mobile apps to e-commerce sites and SaaS products for the past 15 years. She's led marketing teams to build multi-million dollar revenues and is passionate about growth and conversion optimization. Claire loves to work directly with the world's top app companies delivering tools to help them improve their apps. You can connect with her on LinkedIn.
Enjoying the read? You may also like these
 5 tips for managing app store reviews and ratings
 Excellence in app store review management is key when it comes to making apps more useful, beautiful & profitable. See our tips to manage reviews effectively.
Discover the power of review management for app developers: Monitoring, analyzing, and responding to reviews to fuel app growth and user engagement.
5-star review replies should be formed part of the business app reply strategy. Learn what makes up the components of an exceptional 5-star review reply.
Gain insights from our experience with mobile apps combined with the latest trends to elevate your app’s user experience and improve app ratings in 2024.


